Live
Enterprise AI Layer
Which orders actually make money?
An AI layer on top of your ERP: ingestion, warehouse, 229 governed metrics and eleven role dashboards in one application, connected in an hour.
Fivetran + Snowflake + dbt + Looker, in one application
TESSERA RP · DASHBOARD
229
Governed metrics
11
Role dashboards
Built for
Finance leads
Operations and supply chain
Direct-to-consumer brands
Anyone retiring a four-vendor stack
What it solves
The problem, and what changes.
Before
With Tessera RP
01
The margin number leaves out freight, fees and returns: 18–30% of net revenue on a direct-to-consumer line.
Seven cost components on every order line, and true contribution margin computed by the database.
02
Four vendors, four bills, and an analytics engineer holding them together.
One application replaces extract-and-load, warehouse, modelling and BI.
03
Spreadsheets that disagree, because each derives margin its own way.
229 metrics, each with one definition and an owner. Every answer names the one it used.
One layer
The margin after freight, fees and returns.
Tessera RP reads the ERP and the storefronts without writing back, puts freight, fees and returns on the order line, and answers questions in English from 229 governed metrics — naming the one it used and the window it ran over.
← Swipe for the whole diagram →
Why it's different
The short case for Tessera RP.
01
229
Governed metrics
Across 14 domains, each with an owner.
02
11
Role dashboards
One set of definitions, instead of one dashboard eleven people argue over.
03
1 hr
Credentials to dashboard
Dynamics 365, Business Central, NetSuite, Acumatica, Shopify, Amazon.
04
4,214
Tests
Tenant isolation proven against a live database.
See it
The product, screen by screen.
06 SCREENS · CLICKTAP TO ENLARGE
Tessera RP
01 / 06
01
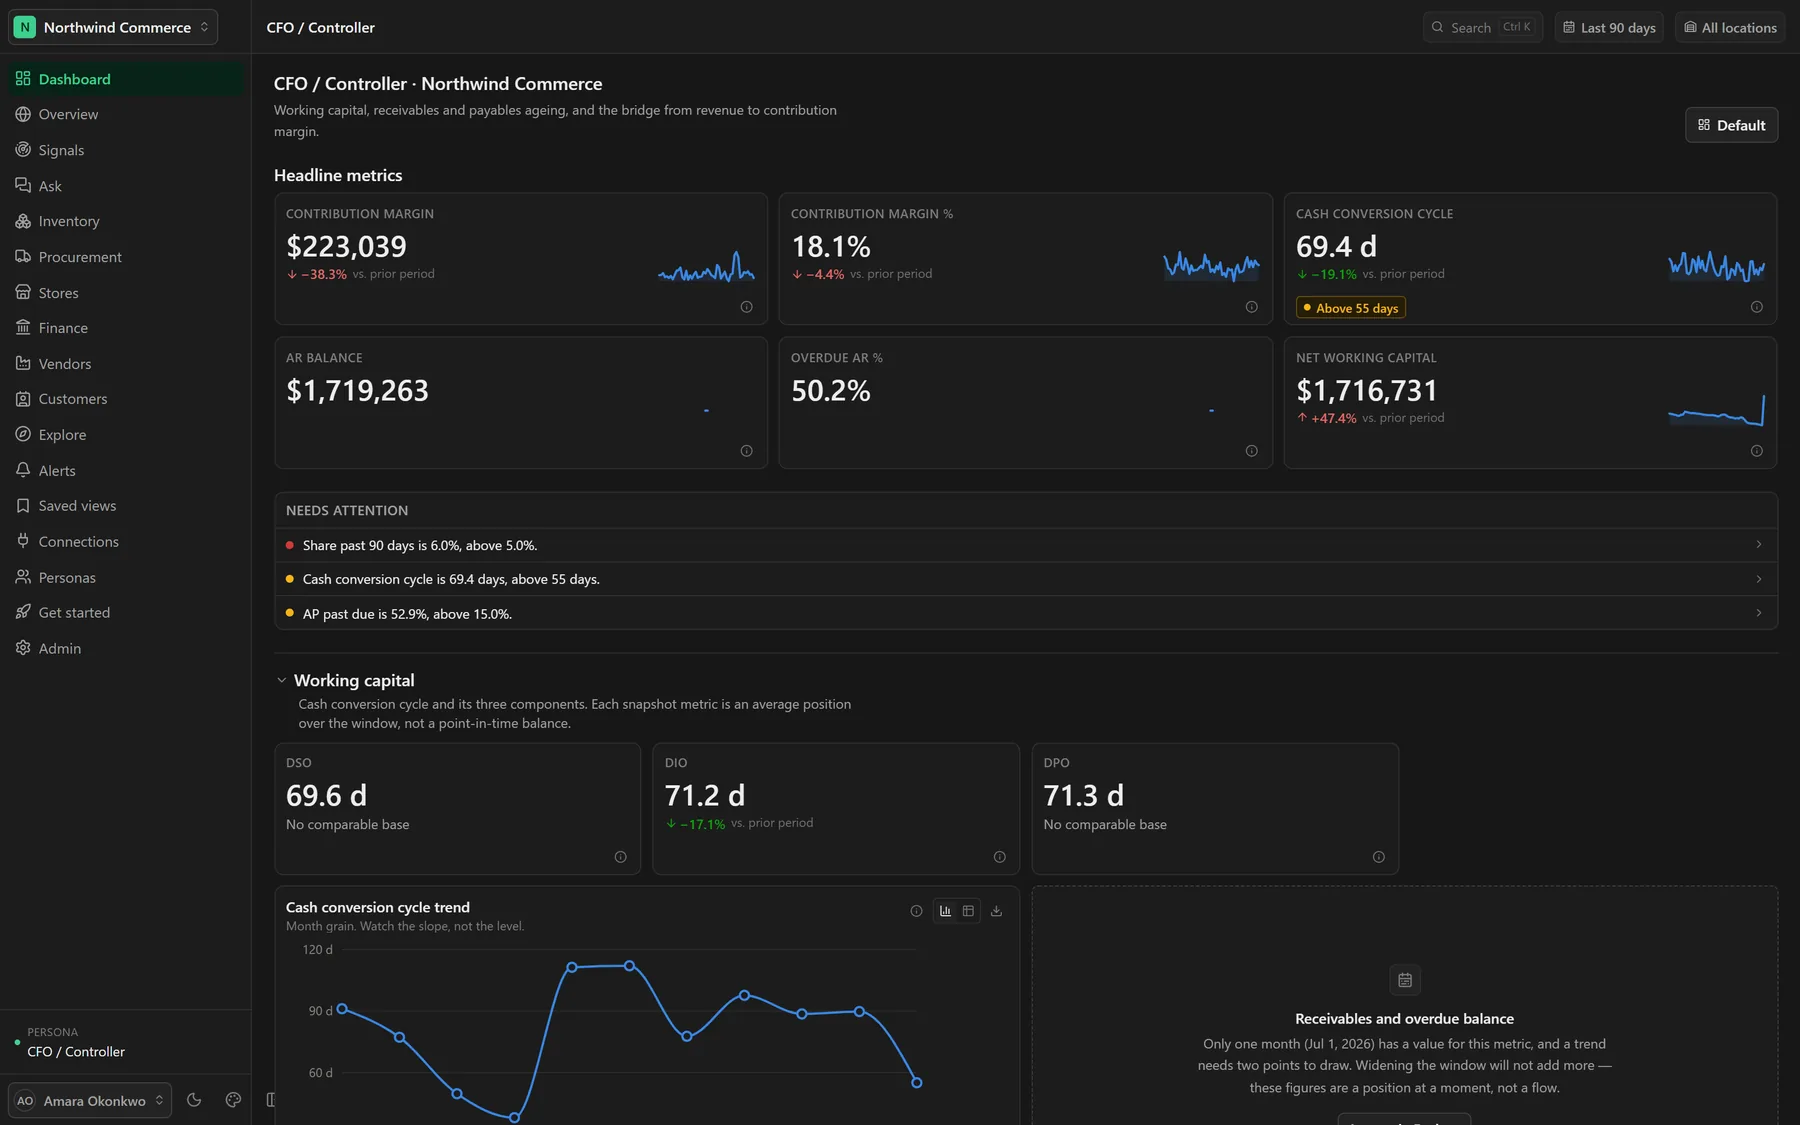
Dashboard
Eleven roles, eleven dashboards, one set of definitions — instead of one dashboard eleven people argue over.
The CFO opens on cash conversion cycle and AR dilution. Merchandising opens on sell-through and markdown. Supply chain opens on weeks of cover. Same numbers underneath.
Four to six headline figures decide whether the rest of the page is worth reading.
Breached thresholds are named in plain language with the band they crossed, and click through to the tile that explains them.